Graph Data Modelling
Brahmand leverages ClickHouse’s powerful table engines to natively model property-graph data.
In a property graph, both nodes and relationships (edges) can have properties. Consider this example:
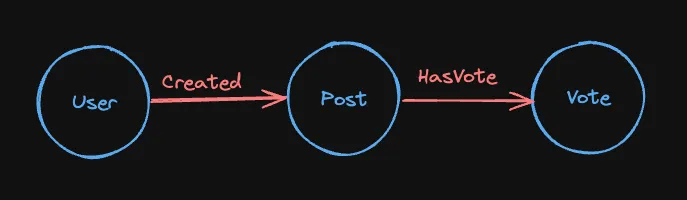
- Nodes:
User,Post,Vote - Relationships:
Created,HasVote
Brahmand keeps separate tables for nodes and relationships
It uses two data structure to model the relationships.
- Edge List
Nodes: U = User, P = PostEdges: U1 –[created]→ P1 U1 –[created]→ P3 U3 –[created]→ P2| U | P ||-----|-----|| 1 | 1 || 1 | 3 || 3 | 2 |- Adjacency list
Nodes: U = User, P = PostEdges: U1 –[created]→ P1 U1 –[created]→ P3 U3 –[created]→ P2| U | P ||-----|-------|| 1 | [1,3] || 3 | 2 |Graph Modeling in Clickhouse
Section titled “Graph Modeling in Clickhouse”Nodes: Merge Family tables like MergeTree, ReplacingMergeTree Columns: (nodeId, props...) e.g (1, 'title', 'body')Edges: Merge Family tables like MergeTree, ReplacingMergeTree for edge list Columns: (from, to, props...) e.g (1, 3, props...)Work is underway on edge indexes using materialized views and bitmaps to improve both storage efficiency and traversal performance.
Edge-Index: AggregatingMergeTree table for adjacency list. One for each direction. Columns: (from, to) e.g (1, [1,3])Materialized view: for each direction (outgoing and incoming) populates its corresponding Edge-Index table from the main Edge table, ensuring the index stays up to date.